Real Output by System Size
| System | Typical annual generation | Roughly equivalent to |
|---|---|---|
| 30kWp | 25,000 to 29,000 kWh | A small office’s full annual demand |
| 100kWp | 85,000 to 95,000 kWh | A mid size warehouse’s daytime load |
| 250kWp | 210,000 to 240,000 kWh | Serious industrial consumption |
The shape matters as much as the total. Generation peaks in summer daytime, exactly when air conditioned or refrigerated sites peak, and delivers perhaps a fifth of its summer output in December. Businesses with daytime, summer weighted demand get the most value per panel.
What Moves the Yield
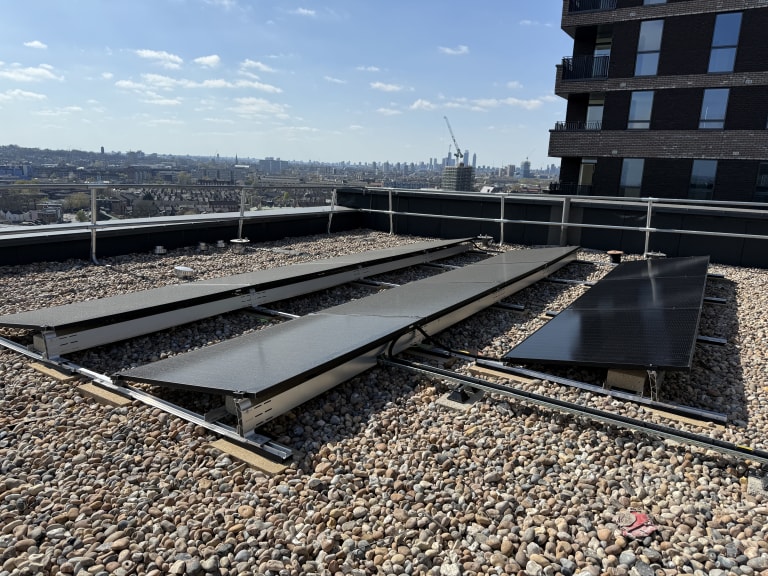
South facing at a 30 to 35 degree pitch is the textbook optimum, and east west arrays on flat roofs run it close while spreading generation across the working day, often better for consumption matching. Shading is the silent killer, a plant room shadow across one string drags the array, which is why the survey maps obstructions rather than eyeballing them. Location matters least of the three: the south coast outperforms Scotland, but by percentage points, not multiples.
Panel degradation is honest and slow, around half a percent a year, with performance warranties guaranteeing output for 25 to 30 years.
From Generation to Money
Every generated unit you consume on site replaces a unit bought at your commercial rate. Surplus exports earn a few pence through export tariffs. That gap is why system design chases your consumption profile, not the biggest possible array, and why the modelling we do uses your actual half hourly data rather than averages.